Below is 7 dimensions of the Model of Coordinated Action (MoCA) model (Lee and Paine, 2015). Cite examples of each and how you feel it might influence a successful collaboration.

This can be a fairly open-ended discussion. Possibly have groups of students pick one, discuss amongst themselves, before going through the group’s thoughts with the class. For example, synchronicity may (or may not) be a key issue as illustrated in the network map below (Fig. 11.1 in DTUI6). The Figure illustrates a network map made with NodeXL software that shows the polarized nature of the conversation on Twitter around the #My2k hashtag that emerge over U.S. budget struggles in 2012.
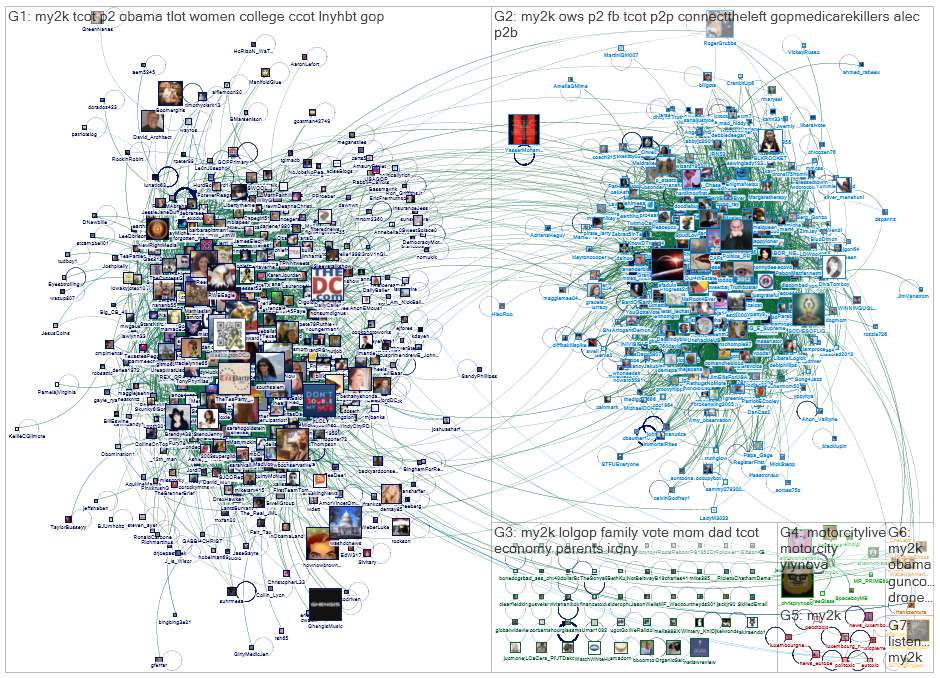
You might also like to view...
Which of the following names might give the human reader some hint about the data that is stored in them?
a. aa, bb, cc b. speed, distance, time c. hypotenuse, leg1, leg2 d. v1, v2, v3 e. principal, interest, payment
Which of the following operations do bidirectional iterators have?
a. Prefix operator* to make available the container element for use as l-value or r-value. b. Overloaded operator+ to add an int value to the iterator to move the place the iterator points forward by the argument number of elements. c. Overloaded operator* to multiply the iterator by an int value to move the place the iterator points by a number of elements equal to the argument. d. Overloaded operator++ to move the place the iterator points forward by one element. e. Overloaded operator-- to move the place the iterator points backward by one element. f. Overloaded operator== and operator!= to determine whether two iterators point to the same element.
The process PID 395 is nginx. How could that be concluded from the output above?
Display the services currently running. a. Use the ps command to display all the programs running in the background:
[analyst@secOps ~]$ sudo ps –elf
[sudo] password for analyst:
F S UID  PID PPID C PRI NI ADDR SZ WCHAN  STIME TTY  TIME     CMD
4 S root 1    0   0 80  0   - 2250 SyS_ep Feb27  ?  00:00:00 /sbin/init
1 S root 2    0   0 80  0   -    0 kthrea Feb27  ?  00:00:00 [kthreadd]
1 S root 3    2   0 80  0   -    0 smpboo Feb27  ?  00:00:00 [ksoftirqd/0]
1 S root 5    2   0 60  -20 -    0 worker Feb27  ?  00:00:00 [kworker/0:0H]
1 S root 7    2   0 80  0   -    0 rcu_gp Feb27  ?  00:00:00 [rcu_preempt]
1 S root 8    2   0 80  0   -    0 rcu_gp Feb27  ?  00:00:00 [rcu_sched]
1 S root 9    2   0 80  0   -    0 rcu_gp Feb27  ?  00:00:00 [rcu_bh]
1 S root 10   2   0 -40 -   -    0 smpboo Feb27  ?  00:00:00 [migration/0]
1 S root 11   2   0 60  -20 -    0 rescue Feb27  ?  00:00:00 [lru-add-drain]
5 S root 12   2   0 -40 -   -    0 smpboo Feb27  ?  00:00:00 [watchdog/0]
1 S root 13   2   0 80  0   -    0 smpboo Feb27  ?  00:00:00 [cpuhp/0]
5 S root 14   2   0 80  0   -    0 devtmp Feb27  ?  00:00:00 [kdevtmpfs]
1 S root 15   2   0 60  -20 -    0 rescue Feb27  ?  00:00:00 [netns]
1 S root 16   2   0 80  0   -    0 watchd Feb27  ?  00:00:00 [khungtaskd]
1 S root 17   2   0 80  0   -    0 oom_re Feb27  ?  00:00:00 [oom_reaper]
b. In Linux, programs can also call other programs. The ps command can also be used to display such process hierarchy. Use –ejH options to display the currently running process tree.
[analyst@secOps ~]$ sudo ps –ejH [sudo] password for analyst:c. As mentioned before, servers are essentially programs, often started by the system itself at boot time. The task performed by a server is called service. In such fashion, a web server provides web services. The netstat command is a great tool to help identify the network servers running on a computer. The power of netstat lies on its ability to display network connections. In the terminal window, type netstat.1 1 1 ? 00:00:00 systemd 167 167 167 ? 00:00:01 systemd-journal 193 193 193 ? 00:00:00 systemd-udevd 209 209 209 ? 00:00:00 rsyslogd 210 210 210 ? 00:01:41 java 212 212 212 ? 00:00:01 ovsdb-server 213 213 213 ? 00:00:00 start_pox.sh 224 213 213 ? 00:01:18 python2.7 214 214 214 ? 00:00:00 systemd-logind 216 216 216 ? 00:00:01 dbus-daemon 221 221 221 ? 00:00:05 filebeat 239 239 239 ? 00:00:05 VBoxService 287 287 287 ? 00:00:00 ovs-vswitchd 382 382 382 ? 00:00:00 dhcpcd 387 387 387 ? 00:00:00 lightdm 410 410 410 tty7 00:00:10 Xorg 460 387 387 ? 00:00:00 lightdm 492 492 492 ? 00:00:00 sh 503 492 492 ? 00:00:00 xfce4-session 513 492 492 ? 00:00:00 xfwm4 517 492 492 ? 00:00:00 Thunar 1592 492 492 ? 00:00:00 thunar-volman 519 492 492 ? 00:00:00 xfce4-panel 554 492 492 ? 00:00:00 panel-6-systray 559 492 492 ? 00:00:00 panel-2-actions 523 492 492 ? 00:00:01 xfdesktop 530 492 492 ? 00:00:00 polkit-gnome-au 395 395 395 ? 00:00:00 nginx 396 395 395 ? 00:00:00 nginx 408 384 384 ? 00:01:58 java 414 414 414 ? 00:00:00 accounts-daemon 418 418 418 ? 00:00:00 polkitd
[analyst@secOps ~]$ netstat
Active Internet connections (w/o servers)
Proto Recv-Q Send-Q Local Address           Foreign Address         State
tcp   0      0      localhost.localdo:48746 localhost.local:wap-wsp ESTABLISHED
tcp   0      0      localhost.localdo:48748 localhost.local:wap-wsp ESTABLISHED
tcp6  0      0      localhost.local:wap-wsp localhost.localdo:48748 ESTABLISHED
tcp6  0      0      localhost.local:wap-wsp localhost.localdo:48746 ESTABLISHED
tcp6  0      0      localhost.local:wap-wsp localhost.localdo:48744 ESTABLISHED
tcp6  0      0      localhost.localdo:48744 localhost.local:wap-wsp ESTABLISHED
Active UNIX domain sockets (w/o servers)
Proto RefCnt Flags Type  State I-Node Path
unix  3      [ ]   DGRAM       8472   /run/systemd/notify
unix  2      [ ]   DGRAM       8474   /run/systemd/
cgroups-agent
d. Use netstat with the –tunap options to adjust the output of netstat. Notice that netstat allows multiple options to be grouped together under the same “- ” sign. The information for the nginx server is highlighted.
[analyst@secOps ~]$ sudo netstat -tunap
[sudo] password for analyst:
Active Internet connections (servers and established)
Proto Recv-Q Send-Q Local Address   Foreign Address State
PID/Program name
tcp   0      0      0.0.0.0:80      0.0.0.0:*       LISTEN
395/nginx: master p
tcp   0      0      0.0.0.0:21      0.0.0.0:*       LISTEN
279/vsftpd
tcp   0      0      0.0.0.0:22      0.0.0.0:*       LISTEN
277/sshd
tcp   0      0      0.0.0.0:6633    0.0.0.0:*       LISTEN
257/python2.7
tcp6  0      0      :::22           :::*            LISTEN
277/sshd
tcp6  0      0      :::23           :::*            LISTEN
1/init
udp   0      0      192.168.1.15:68   0.0.0.0:*
237/systemd-network
Clients will connect to a port and, using the correct protocol, request information from a server. The netstat output above displays a number of services that are currently listening on specific ports. Interesting columns are: ? The first column shows the Layer 4 protocol in use (UDP or TCP, in this case). ? The third column uses the
[analyst@secOps ~]$ sudo ps -elf | grep 395
[sudo] password for analyst:
1 S root 395 1 0 80 0 - 1829 sigsus Feb27 ? 00:00:00
nginx: master process /usr/bin/nginx -g pid /run/nginx.pid; error_log stderr;
5 S http 396 395 0 80 0 - 1866 SyS_ep Feb27 ? 00:00:00
nginx: worker process
0 S analyst 3789 1872 0 80 0 - 1190 pipe_w 14:05 pts/1 00:00:00 grep
395
In the output above, the ps command is piped through the grep command to filter out only the lines containing the number 395. The result is three lines with text wrapping. The first line shows a process owned by the root user (third column), started by another process with PID 1 (fifth column), on Feb27 (twelfth column) with command /usr/bin/nginx -g pid /run/nginx.pid; error_log stderr; The second line shows a process with PID 396, owned by the http user, started by process 395, on Feb27. The third line shows a process owned by the analyst user, with PID 3789, started by a process with PID 1872, as the grep 395 command.
Derive the mathematical relationship between correlation and Euclidean distance when each data point has been been standardized by subtract- ing its mean and dividing by its standard deviation.
Here, we further explore the cosine and correlation measures.