Sketch the graph of the function. Indicate where it is increasing and where it is decreasing. Indicate where any relative extrema occur, where asymptotes occur, where the graph is concave up and where is it concave down, where any points of inflection occur, and where any intercepts occur. f(x) = 
What will be an ideal response?
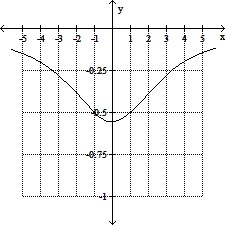
Decreasing on (-?, 0] ; increasing on [0, ?)
Relative minimum at 
Asymptote: y = 0
Concave down on (-?, - ) and (
 , ?); concave up on (-
 ,
,  )
)
Points of inflection:  ,
, 
y-intercept:  ; no x-intercept
You might also like to view...
Solve the problem.The positions of two particles on the s-axis are s1 = sin t and  with s1 and s2 in meters and t in seconds.At what time(s) in the interval 0 ? t ? 2? do the particles meet?
A. t =  ? sec and t =
  ? sec
? sec
B. t =  ? sec and t =
  ? sec
? sec
C. t = ? sec and t = 2? sec
D. t =  ? sec and t =
  ? sec
? sec
Write the numeral as a Roman numeral.1659
A. MDCLXII B. MDCLIX C. MMDCLXII D. MCDLXV
Determine the most appropriate "Interval" for a set of data with a range of 49.
a. 5 b. 7 c. 9 d. 10
Solve and check.18n2 + 60n = 0
A. -  , 0
, 0
B. - 
C. -  , 60
, 60
D. 0