The graph below shows the approximate annual percentage growth rate in world population for the years 1960 through 2010. Data is estimated by the UN Census Bureau.Annual Growth Rate (Percentage) 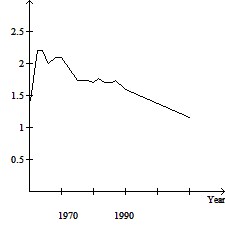 Use the graph to answer the question.Describe the trend in world population during the period 1960-1962
A. It remains constant
B. It increases at a constant rate
C. It increases at a faster and faster rate
D. It decreases at a steady rate
Answer: C
You might also like to view...
Translate the verbal phrase into a mathematical expression. Use x to represent the unknown number.169 divided by some number
A. 
B. 169 - x
C. 169 + x
D. 169x
Perform all operations in correct order.9 × 8 - (14 - 8) ÷ 3 - (9 - 8)
A. 13 B. 53 C. 69 D. 21
Solve the problem.Find the range for the scores: 19, 27, 62, 40, 58, 66.
A. 47 B. 85 C. 40 D. 42.5
Determine any local or absolute extrema as indicated.Estimate graphically the local extrema of 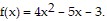
A. Local maximum: -4.56; local minimum: 0.63 B. No local maximum; local minimum: 0.63 C. Local maximum: -4.56; no local minimum D. No local maximum; local minimum: -4.56