The broken-line graph shows the percent of adults in the United States over 18 years old who took the influenza vaccine during recent years. Use the graph Between what two consecutive years was there a decrease in the percent of U.S. adults aged 18 and older taking the influenza vaccine?
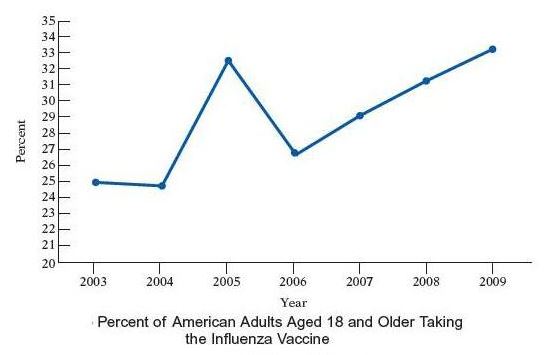
A) 2006 and 2007
B) 2005 and 2006
C) 2004 and 2005
D) 2004 and 2006
E) 2005 and 2007
B) 2005 and 2006
Health & Biomechanics
You might also like to view...
A medical term that means pertaining to the cornea is ________.
Fill in the blank(s) with the appropriate word(s).
Health & Biomechanics
What modality of physical activity is optimal to obtain health benefits?
What will be an ideal response?
Health & Biomechanics
Verify that the triangles are similar.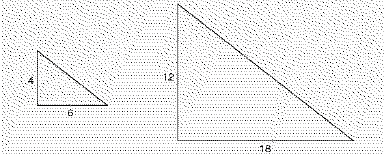
What will be an ideal response?
Health & Biomechanics
The ability of a neuron to respond to a stimulus is termed
A. repolarization. B. depolarization. C. conductivity. D. irritability.
Health & Biomechanics