Identify the abuse of statistics.The graph shows the increases in a certain expenditure over a four-year period. What is wrong with the graph? 
What will be an ideal response?
The bars are not drawn in the correct proportions.
Mathematics
You might also like to view...
Write as an improper fraction.206
A. 1030
B. 
C. 211
D. 
Mathematics
Use the vertical line test to determine whether the graph represents a function.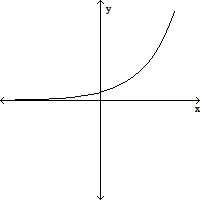
A. not a function B. function
Mathematics
Rewrite with positive exponents, and simplify, if possible.p-3/4
A. - p3/4
B. - 
C. p4/3
D. 
Mathematics
Simplify the following expressions. Simplified expressions must be in lowest terms, and exponents must be positive numbers.![]()
A. ![]()
B. ![]()
C. ![]()
D. none of these
Mathematics