Present data in the form of tables. For the data set shown by the table, a. Create a scatter plot for the data. b. Use the scatter plot to determine whether an exponential function or a logarithmic function is the best choice for modeling the data.Percentage of Population Living in the South Suburbs of a Large City 
What will be an ideal response?
a.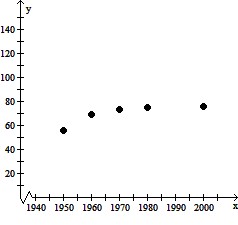
b. Logarithmic Function
Mathematics
You might also like to view...
Evaluate the integral. dx
dx
A. -ln  + C
+ C
B. ln  + C
+ C
C. 5 ln  + C
+ C
D. 5 ln  + C
+ C
Mathematics
Evaluate the sum. Round to the nearest hundredth, if necessary. 
A. -8 B. -40 C. 40 D. 256
Mathematics
Solve the problem.The distance from the downtown station to the last stop on a commuter railroad line is 35 miles. The distance between stops is 2.5 miles. How many stops are there, not including the downtown station?
A. 13 stops B. 7 stops C. 14 stops D. 15 stops
Mathematics
Differentiate.y =  5
5
A. 
B. 
C. 
D. 
Mathematics