Refer to the below graph of the supply and demand for agricultural products. Which of the following best describes the long-run decline of the U.S. agricultural industry?
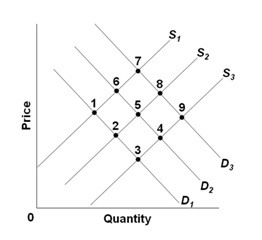
A. A shift in supply from S1 to S2 and a shift in demand from D2 to D1
B. A shift in supply from S1 to S3 and a shift in demand from D1 to D2
C. A shift in supply from S3 to S1 and a shift in demand from D1 to D3
D. A shift in supply from S1 to S2 and a shift in demand from D3 to D1
B. A shift in supply from S1 to S3 and a shift in demand from D1 to D2
You might also like to view...
Assume that the demand curve for oranges is downward-sloping and the supply curve for oranges is upward-sloping. If the government imposes an excise tax of 10¢ per orange, then the total price (including the tax) that demanders must pay for an orange
a. remains unchanged. b. rises by less than 10¢ per orange. c. rises by exactly 10¢ per orange. d. rises by more than 10¢ per orange.
Suppose there is a $200 billion recessionary ga
What will be an ideal response?
Applying a price of labor to the law of diminishing returns generates:
a. the law of increasing costs. b. less output as more labor is hired. c. differences in the quality of labor. d. a negatively-sloped labor supply curve. e. specialization and the division of labor.
If a 10 percent decrease in the price of a good leads to a 20 percent increase in the quantity demanded, then what is the price elasticity of demand?
A. 10 B. 2 C. 0.5 D. 20