Graph the function f(x) over the given interval. Partition the interval into 4 subintervals of equal length. Then add to your sketch the rectangles associated with the Riemann sum  , using the indicated point in the kth subinterval for ck.f(x) = x2 - 3, [0, 8], left-hand endpoint
A. 
B. 
C. 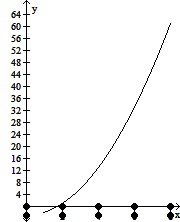
D. 
Answer: D
Mathematics
 -
-