Which city shows a greater increase in precipitation during the 1982-83 El Niño event?
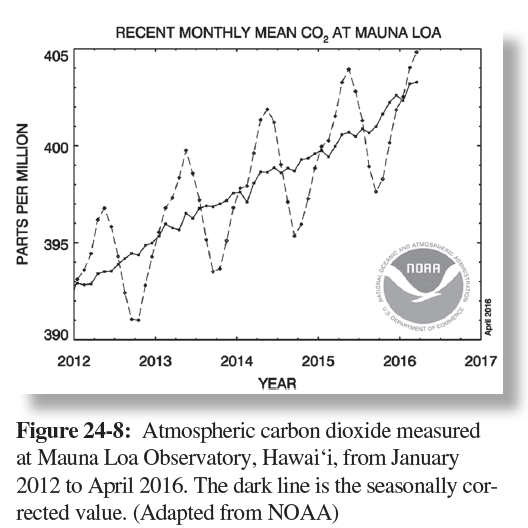
The question is based on Figure 24-8, charts showing annual precipitation in Tucson, Arizona, and Bozeman, Montana, from 1905 to 2015.
What will be an ideal response?
Tucson
You might also like to view...
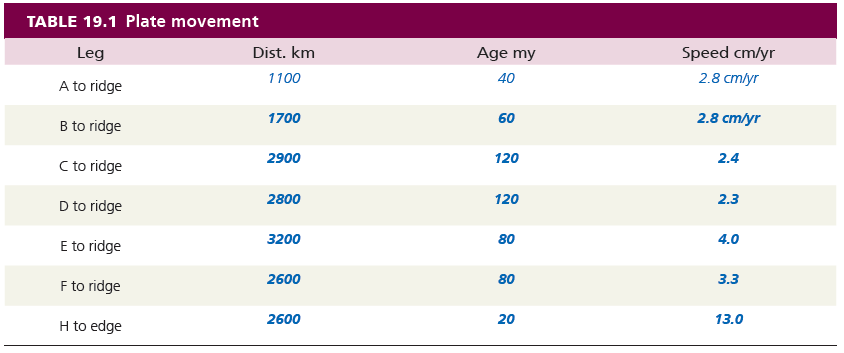
Are the three sections in the Atlantic that you measured moving at the same speed? Are both sides of the ridge moving at the same speed? Which section is moving the fastest?
During the early years of Earth, lighter elements such as silicon, magnesium, and aluminum rose to the surface, forming
Earth’s crust.
a. True b. False
Maps are secondary data sources when
A. they express coordinates not only in latitude-longitude but also in at least one other survey system. B. they are available in both paper and online formats. C. they have undergone two or more revisions in order to enhance their accuracy. D. they are used to provide an interpretation for addressing some other question.
Lakes are common in areas which have been recently ________
A) formed by volcanoes B) glaciated C) formed from river deposits D) raised above the sea E) hit by meteorites