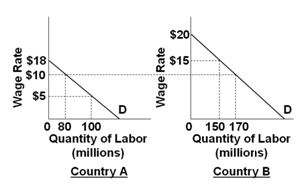
Refer to the below graphs. (Assume that the pre-migration labor force in Country A is 100 and that it is 150 in country B.) Domestic output in country B will, after immigration:
A. Increase by $50M
B. Increase by $250M
C. Decrease by $50M
D. Decrease by $250M
B. Increase by $250M
You might also like to view...
Refer to Table 10-2. Using the table above, what is the approximate growth rate of real GDP from 2014 to 2015?
A) 1% B) 2% C) 3% D) 4%
Suppose you are testing the statistical significance (at the 5% significance level) of a parameter estimate from the regression equation: Y = a + bR + cS + dWwhich is estimated using a time-series sample containing monthly observations over a 30-month time period. The critical value of the appropriate test statistic is
A. Fcritical = 7.76. B. Fcritical = 4.22. C. tcritical = 2.042. D. tcritical = 2.056.
Briefly explain the concept and operation of a fixed exchange rate. How can the government keep the value of the exchange rate within the fix?
What will be an ideal response?
Refer to the given information. If the price level P is 4, Q is:
Answer the question on the basis of the following information for a hypothetical economy. All values are in nominal terms. M = $100 V = 2 C a = $160 X n = $10 G = $10 A. 50. B. 100. C. 200. D. 500.