Solve the problem.The following data represents the average percent of possible sunshine for a certain city in Indiana. 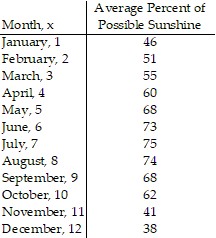 Draw a scatter diagram of the data for one period. Find the sinusoidal function of the form
  that fits the data. Draw the sinusoidal function on the scatter diagram. Use a graphing utility to find the sinusoidal function of best fit. Draw the sinusoidal function of best fit on the scatter diagram.
What will be an ideal response?
y = 15.99 sin (0.57x - 2.29) + 60.62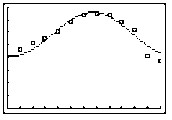
You might also like to view...
Factor the polynomial completely.9x6 - 6x3 - 8
A. 9(x3 - 4)(x3 + 2) B. (3x3 + 4)(3x3 - 2) C. (3x3 + 1)(3x3 - 8) D. (3x3 + 2)(3x3 - 4)
Find the critical point(s) of the function. Then use the second derivative test to classify the nature of each point, if possible. Finally, determine the relative extrema of the function.
?
 ?
?
A.  and
and  ; relative maximum value:
  ; relative minimum value:
B.  and
and  ; saddle point:
  ; relative minimum value:
C.  ; saddle point:
D.  ; relative maximum value:
E. there are no critical points
Match the situation to the graph that models it best.The amount of money y spent on x items having the same cost
A. 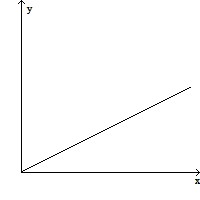
B. 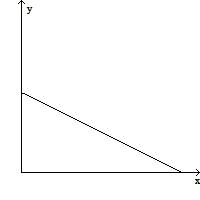
C. 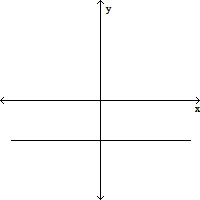
D. 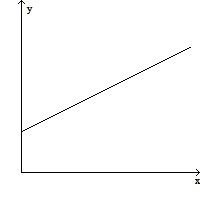
Translate to an equation and solve. 22 is what percent of 11?
A. 200% B. 50% C. 100% D. 150%