Make a line graph of the data.The following table shows the median teacher's salary in District X over several years. Use time on the horizontal scale for your line graph.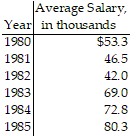
What will be an ideal response?
Answers may vary. The following is a possible answer.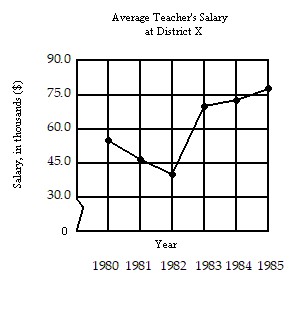
Mathematics
You might also like to view...
Express the number in standard notation.1.4070 × 105
A. 14,070 B. 70.35 C. 140,700 D. 1,407,000
Mathematics
Factor completely.6x3 + 17x2 - 3x
A. x(6x + 1)(x - 3) B. (6x2 - 1)(x + 3) C. x(6x - 1)(x + 3) D. Prime
Mathematics
Multiply.(5x + 3)2
A. 25x2 + 30x + 9 B. 5x2 + 30x + 9 C. 25x2 + 9 D. 5x2 + 9
Mathematics
Find the difference.-10 - (-9)
A. -19 B. 1 C. -1 D. 19
Mathematics