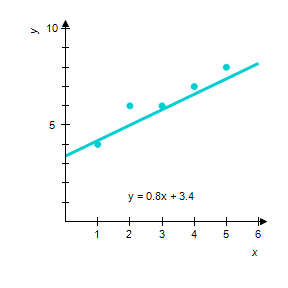
Find the equation of the least-squares line for the given data. Draw a scatter diagram for the given data and graph the least-squares line.
?

?
A. ?
B. ?

C. ?
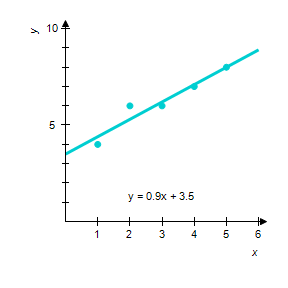
D. ?

Answer: C
Mathematics
You might also like to view...
Use a trigonometric substitution to evaluate the integral.
A. 0.343 B. 0.043 C. 0.069 D. -0.069
Mathematics
In a school survey, students showed these preferences for instructional materials. Answer the question.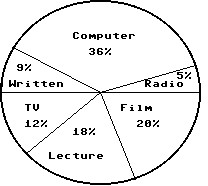 About how many students would you expect to prefer TV in a school of 450 students?
A. About 12 students B. About 90 students C. About 54 students D. About 81 students
Mathematics
Simplify. (Assume all variables are nonzero.) 4
4
A. 
B. 
C. 
D. 
Mathematics
Solve the system.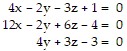
A. 
B. 
C. ?
D. 
Mathematics