Construct a histogram for the given data. The following data are the test scores in Mrs. Brooks' biology class.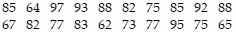 Construct a frequency histogram for the data using the given class intervals in the frequency table below.
What will be an ideal response?
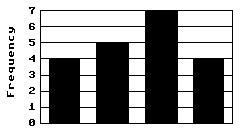
| 60-69 | 70-79 | 80-89 | 90-99 |
You might also like to view...
Multiply, and then simplify if possible. Assume all variables represent positive real numbers.( -
-  )2
)2
A. 18 - 2
B. 77 - 2
C. -4 - 2
D. 18 + 2
You are given a graph of a function of the form f(x) = ax2 + bx + c for different values of a, b, and c. For this function,a. Determine whether the discriminant is positive, negative, or zero.b. Determine if there are 0, 1, or 2 real solutions to f(x) = 0.c. Solve the equation f(x) = 0.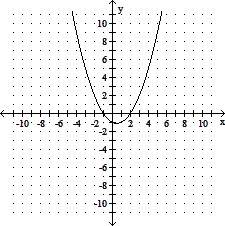
A. a. negative b. 2 c. x = -1, x = -2 B. a. positive b. 2 c. x = 1, x = 2 C. a. zero b. 2 c. x = -1, x = 2 D. a. positive b. 2 c. x = -1, x = 2
Find the requested value.If f(x) = x2 + 5x + 1 and g(x) = 4x - 2, find (fg)(x).
A. 4x3 + 18x2 - 6x - 2 B. 16x2 + 4x - 5 C. 4x3 - 18x2 + 6x - 2 D. 4x3 + 18x2 + 5x - 2
Solve the problem.In a microbiology class of 41 students, 17 students are graduate students. What fraction of the students are not graduate students?
A. 
B. 
C. 
D. 