Graph the linear inequality.y ? 4x
A. 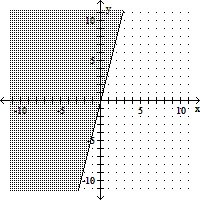
B. 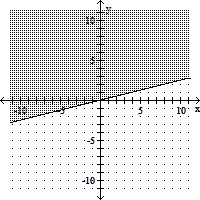
C. 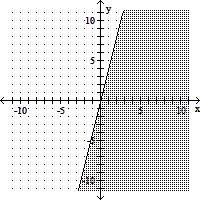
D. 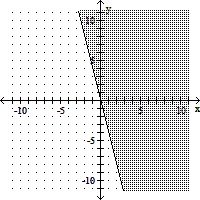
Answer: A
You might also like to view...
Provide an appropriate response.A hypothesis test is conducted with the following hypotheses: Null hypothesis: population mean = 100 Alternative hypothesis: population mean > 100A sample is selected and the sample mean turns out to be 118If the result is significant at the 0.01 level, which of the following is true?
A. If the null hypothesis were true, the chance that the sample mean would have been as big as 118 or bigger is greater than 0.01. B. If the null hypothesis were true, the chance that the sample mean would have been as small as 118 or smaller is less than 0.01. C. If the null hypothesis were true, the chance that the sample mean would have been as big as 118 or bigger is less than 0.01. D. If the alternative hypothesis were true, the chance that the sample mean would have been as big as 118 or bigger is less than 0.01.
Provide an appropriate response.Use the equation 2x2 + 5x = c to explain how to solve a quadratic equation by completing the square.
What will be an ideal response?
Solve the problem.This chart shows the fees for an 18-hole round of golf for each of the last 5 years at a local municipal golf course. Assume that this chart defines a function with the name of f. Find f .
.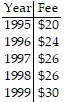
A. $24 B. $20 C. $26 D. $30
The graph of the linear equation y1 is shown on a graphing calculator screen, along with the x-value of the x-intercept of the line. Use the screen to solve the following equation or inequality.y1 = 0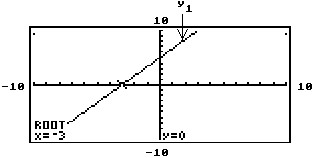
A. {5} B. {0} C. {-3} D. Cannot be determined