Using Figure 1 above, if the aggregate demand curve shifts from AD3 to AD2 the result in the long run would be: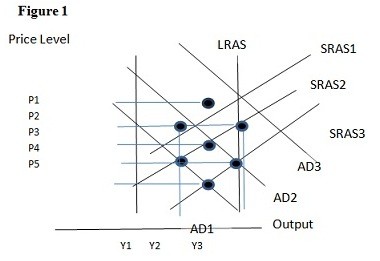
A. P1 and Y2.
B. P2 and Y1.
C. P3 and Y1.
D. P3 and Y2.
Answer: D
You might also like to view...
Suppose a new cost-saving device will generate $1,000 net savings per year to a firm. The device costs $10,000. Should the firm purchase the device?
A) Definitely. B) Absolutely not. C) The firm is indifferent between buying the device and not. D) More information is required to answer.
You are hired as a production analyst at Monopoly-R-Us and you estimate that, at current output, demand is inelastic and marginal cost is positive. You advise your superiors that they can increase profit by
a. raising price until demand becomes unit elastic b. raising price into the elastic range c. lowering price until demand becomes unit elastic d. lowering price into the elastic range e. reduce output without changing price
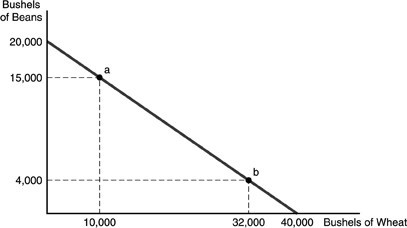 The above figure is referred to as a(n)
A. production possibilities curve. B. supply-demand curve. C. consumption curve. D. scarcity-shortage curve.
Related to the Economics in Practice on p. 455: The Consumer Price Index in the United States was 215.3 in 2008 and 214.5 in 2009. If a retiree received a monthly pension check of $3,200.00 in 2008 and his pension is tied to the CPI, how much would his monthly pension check be in 2009?
A. $3174.40 B. $3,188.11 C. $3,200.00 D. $3,214.50