Which of the following is an accurate comparison between graph 1 and graph 2?
a. Changes in demand cause less of a shift in equilibrium points in graph 1 than in graph 2.
b. Changes in demand cause more of a shift in equilibrium points in graph 1 than in graph 2.
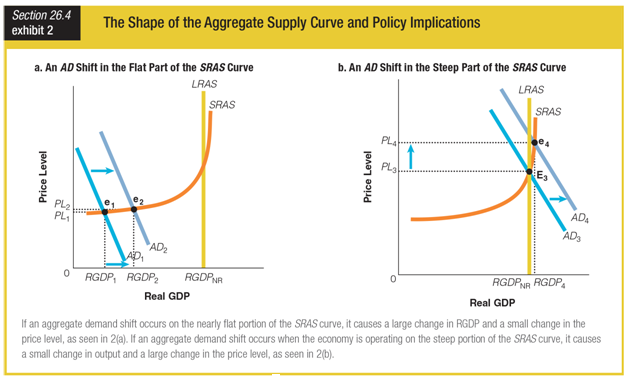
c. Changes in demand will increase RGDP more in graph 1 and price more in graph 2.
d. Changes in demand will increase price more in graph 1 and RGDP more in graph 2.
c. Changes in demand will increase RGDP more in graph 1 and price more in graph 2.
You might also like to view...
In a voluntary exchange,
A) both parties tend to receive more in value than they give u
What does empirical research suggest about the existence of pollution havens?
What will be an ideal response?
Say a competitive firm is producing at point where ATC = $10, AVC = $2. If the firm charges $5 for its output, then in the short-run this firm should
A. exit the industry. B. shutdown production. C. continue to operate. D. try to reduce its fixed costs.
Below are pairs of GDP growth rates and unemployment rates. Economists would be shocked to see most of these pairs in the U. S. Which pair of GDP growth rates and unemployment rates is realistic?
a. 5 percent, 1 percent
b. 3 percent, 5 percent
c. -1 percent, 3 percent
d. -2 percent, 4 percent