Solve the problem. The following table shows the number of adults in a certain city who approve of the mayor's performance in various years. It also gives the total number of adults in the city in the same years. 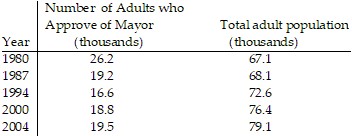 Let p be the percentage of adults in the city who approve of the mayor's performance in the year that is t years since 1980. A reasonable model of the situation is: p =
  Use this model to estimate when 33% of adults in the city will approve of the mayor's performance.
A. 2010
B. 2011
C. 2013
D. 2015
Answer: B
You might also like to view...
The following table shows the running speed R, in feet per second, of animals of length L, in inches. Explain in practical terms the meaning of the slope of the regression equation. L 3.5 6.3 9.4 9.8 R 8.29 15.71 24.01 24.96? ?
A. An increase of 1 inch in length corresponds to an increase of 2.65 feet per second in running speed. B. An increase of 1 inch in length corresponds to an increase of 2.65 feet per second in running speed. C. An increase of 1 inch in length corresponds to an animal that runs 2.65 times faster. D. An increase of 1 inch in length corresponds to an animal that runs 2.65 times faster.
Use the limit comparison test to determine if the series converges or diverges.
A. Converges B. Diverges
Find the tangential and normal components of the acceleration.r(t) = 4(1 + t)3/2i + 4(1 - t)3/2j + 3tk
A. a = 
 N
N
B. a = 3 N
N
C. a = T + 3 N
N
D. a = 3 T
T
Find a quadratic function that best fits the data. Give answers to the nearest hundredth.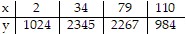
A. y = -4.66x2 - 45.67x + 345.67 B. y = 0.54x2 + 60.05x + 912.48 C. y= -0.7803 + 98.39x - 419.89 D. y = -0.54x2 + 60.05x + 912.48