Use the figure below to answer the following question.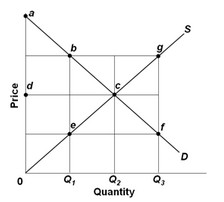 If the output level is Q1, then the sum of the consumer and producer surplus is
A. 0eQ1.
B. 0abe.
C. 0ac.
D. bce.
Answer: B
You might also like to view...
The price elasticity of demand for a specific model of a luxury car is likely to be
A) elastic. B) inelastic. C) 0. D) infinite.
Workers in country A receive an increase in wages of 10 percent at the same time the inflation rate in country A is 8 percent. Workers in country B receive an increase in wages of 3 percent and the inflation rate in country B is 1 percent. In which country are workers better off?
a. Country A because their real wages rise by 18 percent. b. Country A because their real wages rise by 10 percent. c. Country B because the inflation rate is lower. d. Neither country because the increase in real wages is the same.
From the late 1960s to the late 1980s, SAT scores in the United States
a. help explain the productivity increases. b. rose consistently throughout the period. c. declined throughout the period. d. indicated improving workforce quality.
Wages and prices are many times higher today than they were 30 years ago, yet people do not work a lot more hours or buy fewer goods. How can this be?