Solve the problem.The population of a formerly endangered mouse is now on the rise. The population, N, over the last 8 years can be represented with the following graph: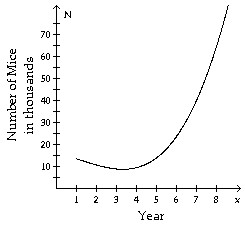 When was the mice population the lowest?
A. Just after the end of the third year.
B. At the beginning of the 8 year period.
C. Just before the end of the second year.
D. During the fifth year.
Answer: A
Mathematics
You might also like to view...
Write the numbers in numerical order, smallest to largest.|-7|, -|15|, -|1|
A. -|15|, -|1|, |-7| B. -|1|, |-7|, -|15| C. |-7|, -|1|, -|15| D. -|-1|, -|15|, |-7|
Mathematics
Solve by the quadratic formula. If there are no real roots, say so.5m2 + 12m + 1 = 0
A. m = 
B. m = 
C. m = 
D. m = 
Mathematics
XC = 72.7 ê IC = 28.2 mA IR = 38.8 mA

Mathematics
Evaluate the series, if it converges.9 -  +
+  -
-  + . . .
A. - 
B. Does not converge
C. 
D. 
Mathematics