Solve the problem.The following graph shows the private, public and total national school enrollment for students for select years from 1970 through 2000.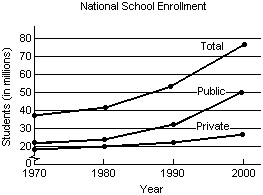 i) How is the graph for total school enrollment, T, determined from the graph of the private enrollment, r, and the public enrollment, u?ii) During which 10-year period did the total number of students enrolled increase the least?iii) During which 10-year period did the total number of students enrolled increase the most?
A.
| i) | T is the sum of r and u. |
iii) 1980-1990
B.
| i) | T is the sum of r and u. |
iii) 1990-2000
C.
| i) | T is the difference of r and u. |
iii) 1990-2000
D.
| i) | T is the sum of r and u. |
iii) 1970-1980
Answer: B
Mathematics
You might also like to view...
Use the limit definition of the partial derivative to compute the indicated partial derivative of the function at the specified point.Find  at the point (9, -1): f(x, y) = 7 - 3xy + 6xy2
What will be an ideal response?
Mathematics
At one high school, the mean time for running the 100-yard dash is  with a standard deviation of 0.9 seconds. The times are very closely approximated by a normal curve. Find the percent of times that are:Between 16.1 and 17 seconds
A. 34% B. 13.6% C. 12% D. 27%
Mathematics
Find the power dissipated at fCO in a high pass RC filter circuit when R = 4.7 Kê, C = 500 pF, and Vin = 30 V.
a. 58.3 mw b. 47.0 mw c. 95.6 mw d. 116.5 mw e. 191.5 mw
Mathematics
Use the quotient rule to simplify the expression.
A. d6 - d B. d7 C. 6 D. d5
Mathematics