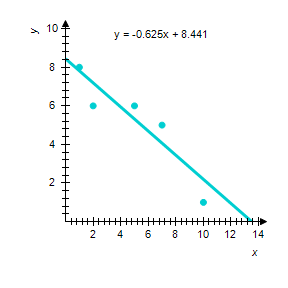
Find the equation of the least-squares line for the given data. Draw a scatter diagram for the given data and graph the least-squares line.
?

?
Please round the coefficients in your equation to three decimal places.
?
A. ?

B. ?
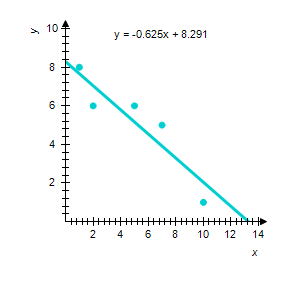
C. ?
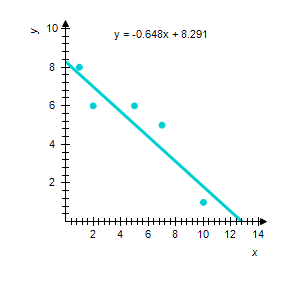
D. ?
Answer: A
You might also like to view...
Provide an appropriate response. Tuan gets a 3.5% raise each year. His beginning salary is $21,500. What is his salary after three such raises?
A. $66,757.50 B. $22,575 C. $23,837.43 D. $23,031.34
List the intercepts of the graph. 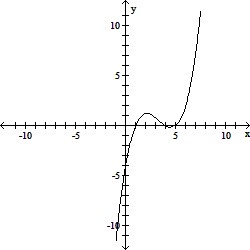
A. (-4, 0), (0, 4), (0, 1), (0, 5) B. (4, 0), (1, 0) (5, 0), (0, -4) C. (-4, 0), (1, 0), (-5, 0), (0, -4) D. (-4, 0), (0, -4), (0, 1), (0, -5)
Solve the problem.A cylindrical container has a volume of 1936? cm3 and a radius of 11 cm. Find the height of the container.
A. 11 cm B. 16 cm C. 4 cm D. 22 cm
Graph the function. Use the graph to find any relative maxima or minima.f(x) = |x + 1| - 3
A. Relative maximum of 3 at x = -1 B. Relative minimum of -3 at x = -1 C. Relative minimum of 3.2 at x = -1 D. Relative minimum of 2.7 at x = -1