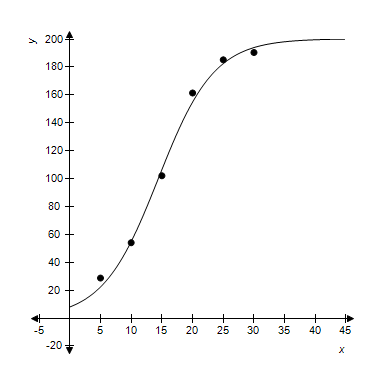
Plot the following data points along with a graph of the model obtained using logistic regression.
x 5 10 15 20 25 30 y 28.77 54.12 102.11 161.44 185.21 190.45?
?
What will be an ideal response?
You might also like to view...
Transform the polar equation to an equation in rectangular coordinates. Then identify and graph the equation.r = 5 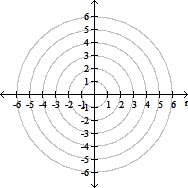
A. 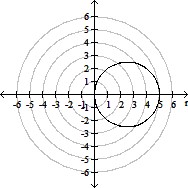
 2 + y2 =
  ; circle,
radius  , center at
  in
in
rectangular coordinates
B. 
x2 +  2 =
2 =  ; circle,
radius  , center at
  in
in
rectangular coordinates
C. 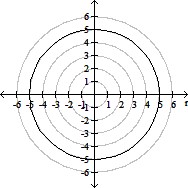
x2 + y2 = 25; circle, radius 5,
center at pole
D. 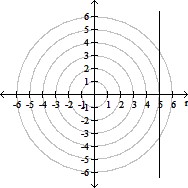
x = 5; vertical line 5 units to the right
of the pole
Solve the problem.How many liters of a 30% alcohol solution must be mixed with 50 liters of a 90% solution to get a 50% solution?
A. 15 L B. 10 L C. 150 L D. 100 L
Provide an appropriate response.Consider the linear equation in three variables  . Find a pair of linear equations that, when considered together with the given equation, will form a system having infinitely many solutions.
What will be an ideal response?
Solve.x5 - 4x3 ? 0
A. [-2, 0] ? [2, ?) B. (-?, -2] ? [0, 2) C. (-?, -2] ? [2, ?) D. [-2, ?)