Refer to the double-bar graph below which shows the number of male and female athletes at a university over a four-year period. Solve the problem.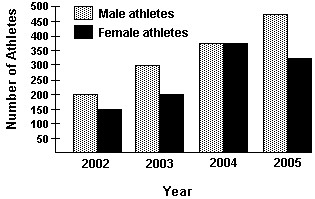 In which year did the greatest difference between the number of male athlete and female athletes occur? Find the difference.
A. 2005; 100 athletes
B. 2003; 100 athletes
C. 2005; 200 athletes
D. 2005; 150 athletes
Answer: D
Mathematics
You might also like to view...
You will select a card, from a standard 52-card deck, replace it back into the deck, and select another card. What is the probability of selecting a 6 and a queen? ?
A.
?
B.
?
C.
?
D.
?
E.
?.0075 rounded to the nearest ten-thousandths
Mathematics
Provide an appropriate response.Why do you think additive identity is a valid name for 0?
What will be an ideal response?
Mathematics
Provide an appropriate response.A whole number is understood to have a decimal point at the  .
.
Fill in the blank(s) with the appropriate word(s).
Mathematics
Rewrite the given expression without exponents.
A.  ? x + x + y + y + y + y
B.  ? x ? x ? x ? x ? y ? y
C.  ? x + x + x + x + y + y
D.  ? x ? x ? y ? y ? y ? y
Mathematics