Refer to the graphs shown. The market is caviar. Which graph best represents the impact of an increase in consumer incomes on the market for caviar?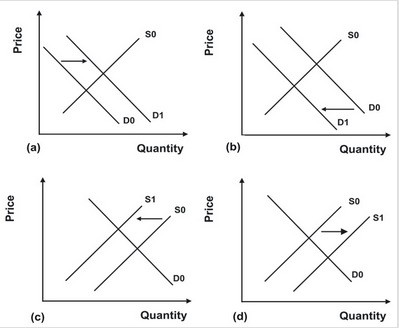
A. Graph a
B. Graph b
C. Graph c
D. Graph d
Answer: A
You might also like to view...
Occupational licensing is an example of an entry barrier that improves a country's standard of living
Indicate whether the statement is true or false
Which of the following is not an example of a transfer payment?
A. social security. B. sales tax. C. unemployment benefits. D. workman’s compensation.
The U.S. merchandise trade balance has been in surplus over the last 20 years
Indicate whether the statement is true or false
QN=68 (17773) Quality Motors is a Japanese-owned company that produces automobiles; all of its automobiles are produced in American plants. In 2007, Quality Motors produced $20 million worth of automobiles, with $12 million in sales to Americans, $6 million in sales to Canadians, and $2 million worth of automobiles added to Quality Motors' inventory. The transactions just described contribute how much to U.S. GDP for 2007?
a. $12 million b. $14 million c. $20 million d. $34 million