What is the measure of responsiveness of quantity demanded of a product to a change in its price? Why is it a negative number for a typical good? With the help of suitable diagrams, explain the difference between elastic and inelastic demand.
What will be an ideal response?
POSSIBLE RESPONSE: The price elasticity of demand is a measure of responsiveness of quantity demanded of a product to a change in its price. The price elasticity of demand measures the percentage change in quantity demanded of a product resulting from a 1 percent change in its price. It is a unit-free measure. Since an increase in price of a typical product results in a decrease in its quantity demanded and vice versa, the price elasticity of demand is a negative number. The difference between price-elastic and price-inelastic demand can be explained with the help of the following two figures.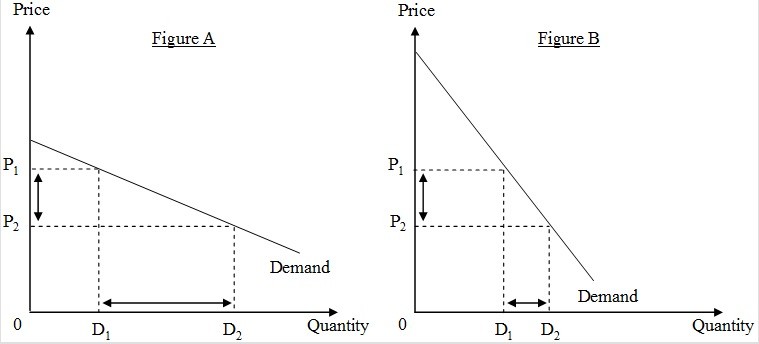
The two figures show two demand curves, each with the same starting point of price P1 and quantity D1. Now consider the same decrease in price, from P1 to P2, for each figure. Let's say that this change in price is a 40 percent decrease. In Figure A, the quantity demanded would change to D2, which is a change of 200 percent. In Figure B, the change in quantity would be to D2, which is a change of 30 percent. For the same starting point (P1 and D1) and the same decrease in price to P2, the price elasticity is -5 (= 200%/(-40%)) for Figure A, and the price elasticity is ?0.75 (= 30%/(?40%)) for Figure B. For this range around the same starting point, demand is price elastic (greater than one in absolute value) for the demand curve shown in Figure A, and demand is price inelastic (less than one in absolute value) for the demand curve shown in Figure B. For the same starting point, the flatter demand curve is more price elastic.
You might also like to view...
Refer to Table 15-4. What is Shakti's profit-maximizing output?
A) 4 units B) 5 units C) 6 units D) 7 units
Which of the following is NOT a function of the Federal Reserve System?
A. regulating the money supply B. offering banking services to households and businesses C. supervising member banks D. acting as the fiscal agent of the federal government
Capital is the cushion banks have against:
A. liquidity risk. B. an unexpected decrease in liabilities. C. moral hazard. D. sudden drops in the value of their assets.
Refer to the figure below, which shows four different Lorenz curves (I, II, III, and IV). Which point would indicate that the top 40% of households earned 60% of the nation's total income?
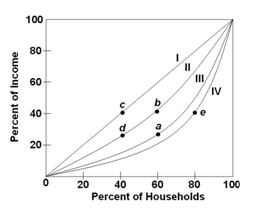
A. a
B. b
C. d
D. e