The above figure shows the U.S. market for wheat. With international trade, U.S. consumers buy ________ tons of wheat and U.S. producers produce ________ tons of wheat
A) 500,000; 500,000
B) 300,000; 500,000
C) 300,000; 700,000
D) 700,000; 300,000
E) 500,000; 700,000
C
You might also like to view...
Total revenue earned from the sale of a good is:
A) the price at which the good is sold. B) the difference between price and cost of production of the good. C) the product of price and quantity of the good sold in the market. D) the product of cost of production and quantity of the good sold in the market.
In the above figure, the demand for loanable funds curve is drawn for the average expected profit. If the real interest rate is constant at 6 percent and the expected profit falls, the amount of loanable funds demanded will be
A) less than $450 billion. B) $450 billion. C) between $450 billion and $600 billion. D) greater than $600 billion.
Refer to the figure shown, which represents the production possibilities frontiers for Countries A and B. Country A has the comparative advantage in:
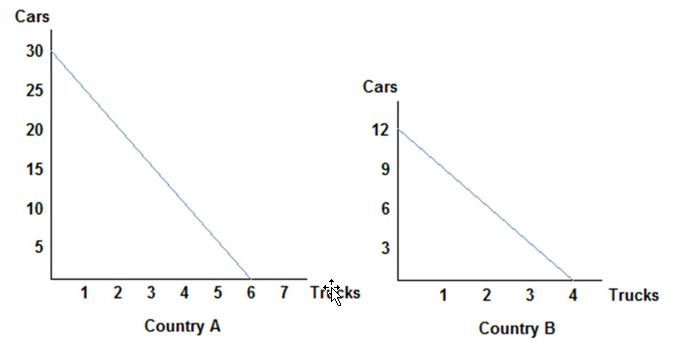
A. cars and Country B has the comparative advantage in trucks.
B. trucks and Country B has the comparative advantage in cars.
C. cars and trucks.
D. neither cars nor trucks.
The logic of collective action explains the persistence of tariffs and quotas as an outcome that is driven by the asymmetry between
A. the benefits distributed across many consumers versus the concentration o f the costs in the hands of a few firms. B. the benefits distributed across many firms versus the concentration of the costs in the hands o f a few consumers. C . the benefit s concentrated in the hands of the few consumers, versus the costs distributed across many firms. D. the benefits concentrated in the hands o f the few firms, versus the costs distributed across many consumers.