The figure shows the graphs of the cost and revenue functions for a company that manufactures and sells binoculars. Use the information in the figure to answer the question.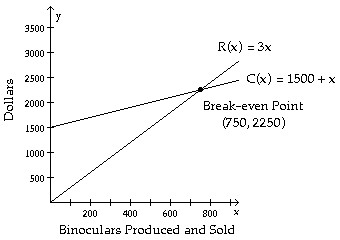 At the break-even point both cost and revenue are what?
A. $750
B. $1500
C. $2250
D. $2700
Answer: C
Mathematics
You might also like to view...
Graph the inequality.0 < x < 4![]()
A. ![]()
B. ![]()
C. ![]()
D. ![]()
Mathematics
Solve the problem.The circumference of a circle is 5? ft. Find its radius.
A.  ft
ft
B.  ? ft
? ft
C. 5 ft
D. 10 ft
Mathematics
Use synthetic division to divide.(y9 + 1) ÷ (y + 1)
A. y8 + y7 + y6 + y5 + y4 + y3 + y2 + y + 1
B. y8 - y7 + y6 - y5 + y4 - y3 + y2 - y + 1 + 
C. y8 - y7 + y6 - y5 + y4 - y3 + y2 - y + 1
D. y8 + y7 + y6 + y5 + y4 + y3 + y2 + y + 1 + 
Mathematics
Find the x- and y-intercepts of f.f(x) = 5x - x3
A. x-intercepts: 0, -5; y-intercept: 5
B. x-intercepts: 0, -5; y-intercept: 0
C. x-intercepts: 0,  , -
, - ; y-intercept: 0
D. x-intercepts: 0,  , -
, - ; y-intercept: 5
Mathematics