Solve the problem.The one-day temperatures for 12 world cities along with their latitudes are shown in the table below. Make a scatter diagram for the data. Then find the line of best fit and graph it on the scatter diagram.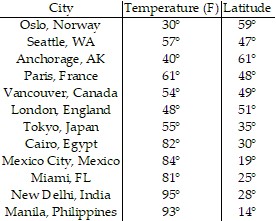 Latitude (degrees)
 Temperature (F)°
What will be an ideal response?
Latitude (degrees)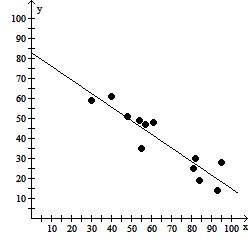
Temperature (F)°
Line of best fit = -0.68x + 82.91
You might also like to view...
Find the flux of the curl of field F through the shell S.F = x5i + 6xj + 7k; S is the upper hemisphere of x2 + y2 + z2 = 4
A. 4? B. 4 C. 24? D. ?
Find the extreme values of the function subject to the given constraint.


A. Maximum: none; minimum: 24 at 
B. Maximum: 51 at  minimum: 30 at
C. Maximum: none; minimum: 30 at 
D. Maximum: 30 at  minimum: 24 at
Divide. 2,363 ÷ 129
A. 13 R 41 B. 18 C. 18 R 41 D. 21 R 29
Complete the ordered pairs so that they are solutions of the given linear equation.5x + y = -13( , 7), ( , 52),( , -13)
A. (-4, 7), (-13, -13), (0, -13) B. (-4, 7), (-13, 52),(0, -13) C. (-4, 7), (-13, -52), (0, 52) D. (-4, -4), (-13, 52), (0, -13)