The figure shows the graphs of the cost and revenue functions for a company that manufactures and sells binoculars. Use the information in the figure to answer the question.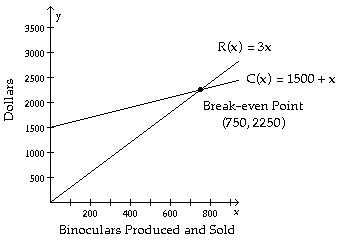 How many binoculars must be produced and sold for the company to break even?
A. 1500 binoculars
B. 750 binoculars
C. 2700 binoculars
D. 2250 binoculars
Answer: B
You might also like to view...
Set up the general equation from the given statement.D varies directly as r and is inversely proportional to  .
.
A. D = kr + 
B. D = 
C. D = krt
D. D = k(r + t)
Solve the problem.The following scatter diagram shows heights (in inches) of children and their ages.Height (inches) Age (years)What is the expected height range for a 2-year old child?
A. 25-38 inches B. 35-45 inches C. 40-50 inches D. 20-30 inches
Let matrix A represent the sales (in thousands of dollars) of a toy company in 1994 in three cities, let B represent the sales in the same cities in 1995, and let C represent the sales in the same cities in 1996.  A =
A =  ; B =
; B =  ; C =
; C =  What is the change in sales between 1994 and 1996?
What will be an ideal response?
Find the intercepts for the graph of the equation.2x + y = 6
A. (6, 2) (2, 6) B. (0, 2) (0, 2) C. (2, 0) (2, 0) D. (3, 0) (0, 6)