Refer to Table 1.5 (in Section 1.3).
a. Using the class intervals in the table, construct a histogram in which the heights of the rectangles are equal to the relative frequencies.
b. Compare the histogram in part (a) with the histogram in Figure 1.9, for which the heights are the densities. Are the shapes of the histograms the same?
c. Explain why the heights should not be set equal to the relative frequencies in this case.
d. Which classes are visually exaggerated by making the heights equal to the relative frequencies?
(a)
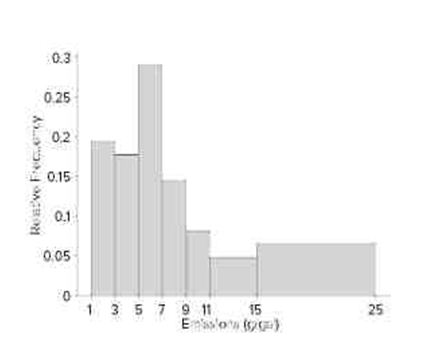
(b) No
(c) The class interval widths are unequal.
(d) The classes 11–<15 and 15–<25
You might also like to view...
What prevents rotting of the cutting?
A) Methyl alcohol B) Captan C) Aspirin D) Green manure
Many technicians love the six-day rotation because ________
A) The only have to work four days per week B) They only work 40 hours per week C) They have a long weekend every three weeks D) All of the above
Which type of motors are typically driven by DC drives?
A. series wound B. shunt wound C. compound motors D. permanent magnet E. both b and d
Schematics are always drawn to show components in their de-energized, or ____________________, state.
Fill in the blank(s) with the appropriate word(s).