The figure shows the percentage of the U.S. population, f(x), made up of teachersas a function of time, x, where x is the number of years after 1900. Use the graph to solve the problem.  Use the graph to estimate f(60).
A. 1%
B. 3%
C. 60%
D. 2%
Answer: D
Mathematics
You might also like to view...
Find the centroid of the region.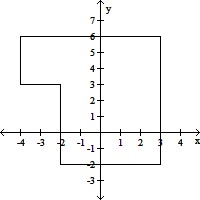
A.  =
=  ,
,  =
= 
B.  =
=  ,
,  =
= 
C.  =
=  ,
,  =
= 
D.  =
=  ,
,  =
= 
Mathematics
Find the area of the region specified by the integral(s).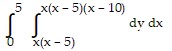
A. 
B. 
C. 
D. 
Mathematics
Use the method of variation of parameters to solve the differential equation.3 + 140
+ 140 + 225y = -10e3x
A. y = C1e-45x + C2e-5x/3 +  e3x
e3x
B. y = C1e-45x + C2e-5x/3 -  e3x
e3x
C. y = C1e-45x + C2e-5x/3 -  e3x
e3x
D. y = C1e-45x + C2e5x/3 -  e3x
e3x
Mathematics
Solve the problem. Round to the nearest tenth if necessary.A label on a box shows that the box weighs 60 kg. How many lbs is that?
A. 152.4 lb B. 27.2 lb C. 132 lb D. 63.6 lb
Mathematics