Make a line graph of the data.The following table shows the average tuition for one semester at City X College over various years. Use time on the horizontal scale for your line graph.
What will be an ideal response?
Answers may vary. A possible answer follows.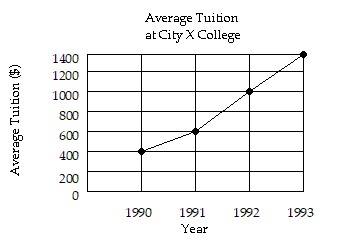
You might also like to view...
Provide an appropriate response.Find A if C = 4 and B = 2. Round answer to the nearest thousandth. 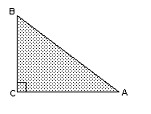
Fill in the blank(s) with the appropriate word(s).
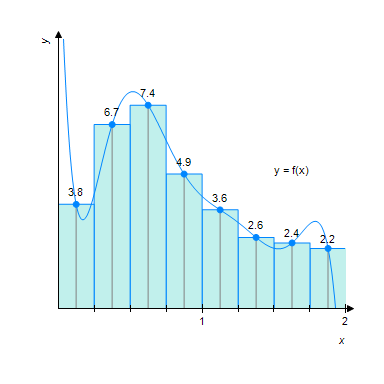
Find an approximation of the area of the region R under the graph of f by computing the Riemann sum of f corresponding to the partition of the interval into the subintervals shown in the accompanying figures. Use the midpoints of the subintervals as the representative points.
?
 ?
?
A. 8.4 sq units B. 8.095 sq units C. 8.47 sq units D. 9.442 sq units
Perform the indicated operations. Write the resulting polynomial in standard form.(2x6 + 2x5 + 3) - (7x6 - 11x5 - 20)
A. -5x6 + 13x5 + 23 B. -5x6 + 13x5 - 17 C. -5x6 + 9x5 - 17 D. 31x11
Rationalize the denominator.
A. 
B. 
C. 
D. 