The graph shows the average time spent doing homework. Use the graph to answer the question.  If 1700 students were surveyed, find the number of students who said they spend 40 minutes or less on homework.
A. 739.5 students
B. 374 students
C. 357 students
D. 731 students
Answer: D
You might also like to view...
Convert the polar equation to a rectangular equation.r = 5 csc ?
A. y2 = 5 B. x2 + y2 = 5 C. x = 5 D. y = 5
Solve the problem using the information given in the table and the specific identification inventory method. Round dollar amounts to the nearest cent.Find the goods available for sale. 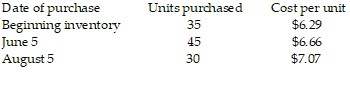
A. 50 units B. 110 units C. 160 units D. 125 units
Write as a decimal.
A. 0.99 B. 0.0099 C. 0.00099 D. 0.099
Solve the problem.The graph shows the sales of a particular brand of appliance from 1992 to 2010, where 1992 corresponds to  . Two of the data points in the graph can be represented by the ordered pairs
  and
and  Use these ordered pairs to write an equation of a line that models the data. Give the equation in slope-intercept form.
A. y = 140x + 600 B. y = 140x + 2000 C. y = 60x + 2000 D. y = 60 + 600