The portion of the long-run average cost curve in which economies of scale are experienced shows that as output increases, the
A) average total cost decreases.
B) average total cost increases.
C) marginal cost increases.
D) marginal cost decreases.
E) average variable cost is constant and the average fixed cost decreases.
A
You might also like to view...
Dana's utility of wealth is 65 units at $3,000, 80 units at $5,000, and 95 units at $9,000. Starting from zero wealth, he must choose between options A and B. Option A gives him $5,000 for sure
Option B gives him $3,000 with probability 0.5 or $9,000 with probability 0.5. Dana will A) choose option A. B) choose option B. C) be indifferent between option A and option B because they have the same risk. D) be indifferent between option A and option B because they have the same expected utility.
Assume that the expectation of a recession next year causes business investments and household consumption to fall, as well as the financing to support it. If the nation has low mobility international capital markets and a fixed exchange rate system, what happens to the net nonreserve international borrowing/lending balance and the monetary base in the context of the Three-Sector-Model? a. The
net nonreserve international borrowing/lending balance becomes more negative (or less positive) and monetary base falls. b. The net nonreserve international borrowing/lending balance becomes more negative (or less positive) and monetary base rises. c. The net nonreserve international borrowing/lending balance becomes more positive (or less negative) and monetary base falls. d. The net nonreserve international borrowing/lending balance and monetary base remain the same. e. There is not enough information to determine what happens to these two macroeconomic variables.
The vertical axis for an aggregate demand curve measures
A. real Gross Domestic Product (GDP). B. the interest rate. C. a nation's production level. D. the price level.
Refer to the information provided in Figure 2.4 below to answer the question(s) that follow.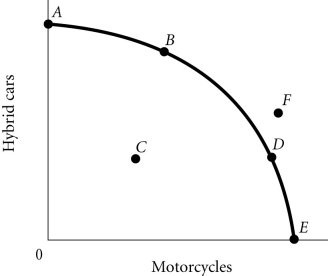 Figure 2.4According to Figure 2.4, Point A necessarily represents
A. only hybrid cars being produced. B. an unattainable production point. C. what society wants. D. the economy's optimal production point.