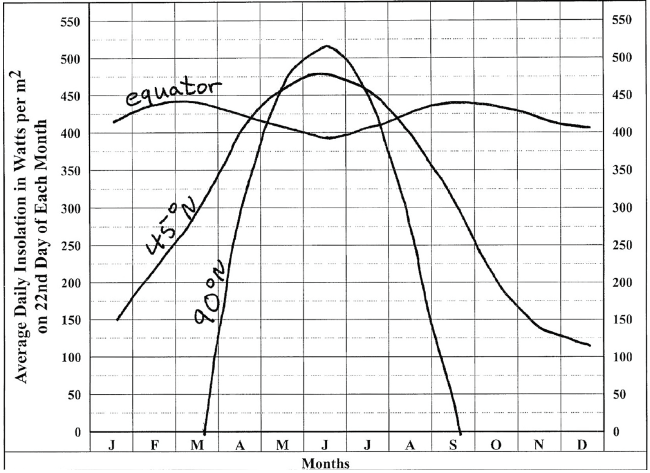
On the chart, use the data to plot the average daily insolation at the top of the atmosphere (in W>m2) for the 22nd day of each month at the equator, 45° N, and 90° N. Connect the values for each latitude with a labeled line (you may also use a red line for the equator, a green line for 45° N, and a blue line for 90° N).
Answer the following questions. Keep in mind that these data show the insolation at the top of the atmosphere—they take into account the angle of incidence of incoming radiation and the length of day, but ignore the effects of the atmosphere.After completing the chart, answer the following questions. Keep in mind that these data show the insolation at the top of the atmosphere—they take into account the angle of incidence of incoming radiation and the length of day, but ignore the effects of the atmosphere.
(a) During a year, which of the three latitudes experiences the least variation in average daily insolation at the top of the atmosphere? Why?
(b) During a year, which of the three latitudes experiences the greatest variation in average daily insolation at the top of the atmosphere? Why?
(c) For how many months of the year does the North Pole receive no insolation? (Note: When answering this question you need to consider the actual period of time the North Pole goes without sunlight each year—interpret Figure 11-3 and your chart in problem 4 carefully; you should be able to answer this question without looking at Figure 11-3 or your chart.)
(d) Which dates mark the beginning and end of this period of zero insolation at the North Pole?
(a) 0°. High angle of incidence and constant day length all year.
(b) 90° N. Six months of constant sunlight and six months without any sunlight.
(c) 6 months
(d) Beginning: September equinox (9/22) End: March equinox (3/22)
You might also like to view...
The relationship between kinetic energy and potential energy is
A) one must have potential energy before kinetic energy can be realized. B) kinetic energy is proportional to the potential energy. C) potential energy is the storage state of kinetic energy. D) in practice, all of a potential energy source is never fully transformed to usable kinetic energy. E) All of the above are true.
The City of San Francisco grew to become the largest city on the West Coast after what?
A) The United States entered WWI B) The turn of the 20th century C) The discovery of gold in California D) The bombing of Pearl Harbor
____________________ is any removal of frozen water mass from a glacier
Fill in the blank(s) with correct word
On which one of the following projections do great circle routes appear as straight lines?
A) A gnomonic projection B) Any conic projection C) Goode's homolosine projection D) Mercator projection