Suppose we are considering the milk market and we have two sets of values, as shown by the numbers in parentheses, which represent two points on a line: (59 billion quarts; $4) and (78 billion quarts; $6). This line is most likely a
A. production possibilities frontier for milk.
B. supply curve for milk.
C. demand curve for milk.
D. ray through the origin.
E. time series line.
Answer: B
You might also like to view...
If the quantity of soccer balls demanded is represented by the demand equation QD = 80 - 2P, then to solve for the price of soccer balls, the equation would be rewritten as
A) P = 40 - 0.5QD. B) P = 1.6QD + 80. C) P = 80 - QD. D) P = QD + 160.
Give three reasons why a demand curve slopes downward to the right.
What will be an ideal response?
If the price elasticity of demand for airline tickets is 2.0 for a leisure traveler and 0.5 for a business traveler, then a price-discriminating monopolist would charge
A) a higher price for the business traveler than the leisure traveler. B) the same price for both travelers. C) a lower price for the business traveler than the leisure traveler. D) a less profitable price for the business traveler than the leisure traveler.
After a price floor of $23 is placed on the market in the graph shown:
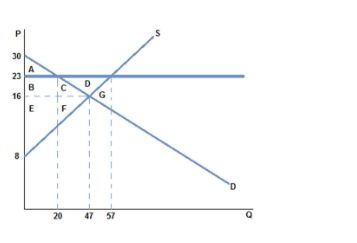
A. some consumers lose because they pay a higher price.
B. some producers gain because they sell at a higher price.
C. the quantity traded in the market falls.
D. All of these are true.