Refer to a normal distribution described by the following figure. The mean is ? and the standard deviation is ?.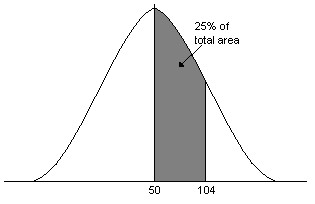
The value of the first quartile Q1 =
A. 27.
B. 0.
C. -4.
D. 40.
E. none of these
Answer: C
You might also like to view...
Given p is true, q is true, and r is false, find the truth value of the statement.(q ? r) ? (p ? q)
A. True B. False
Round the number to the place value indicated.829
A. 700 B. 800 C. 810 D. 900
Provide an appropriate response.Determine whether the graph y =  is symmetric about the x-axis, the y-axis, the origin, or the line
Fill in the blank(s) with the appropriate word(s).
Use the empirical probability formula to solve the exercise. Express the answer as a fraction. Then express the probability as a decimal, rounded to the nearest thousandth, if necessary.The table below represents a random sample of the number of deaths per 100 cases for a certain illness over time. If a person infected with this illness is randomly selected from all infected people, find the probability that the person lives 3-4 years after diagnosis.
A.  ; 0.058
B.  ; 0.538
C.  ; 0.029
D.  ; 0.35