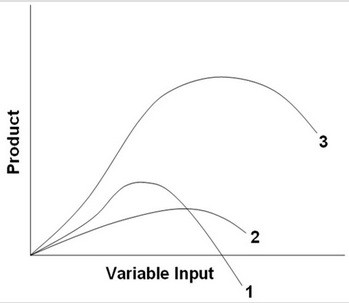
 In the above diagram curves 1, 2, and 3 represent the:
A. total, average, and marginal product curves respectively.
B. total, marginal, and average product curves respectively.
C. marginal, average, and total product curves respectively.
D. average, marginal, and total product curves respectively.
Answer: C
You might also like to view...
People have incentive to efficiently and effectively use land in the public domain or held by a communal group
Indicate whether the statement is true or false
During the last half of 2012, the U.S. unemployment rate was just under 8 percent. Historical experience suggests that this is
a. above the natural rate, so real GDP growth was likely low. b. above the natural rate, so real GDP growth was likely high. c. below the natural rate, so real GDP growth was likely low. d. below the natural rate, so real GDP growth was likely high.
Which of the following is a unique provision of NAFTA?
A) tariff elimination B) common currency C) environmental standards D) immigration oversights and policies
Many economists challenged the idea of activist government intervention in the economy following the
A. recession of 1980-1982. B. inflation of the 1970s and early 1980s. C. recession of 1974-1975. D. all of the above.