Construct a histogram for the given data. The following data are the number of sweatshirts sold each day for 19 days. 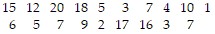 Construct a frequency histogram for the data using the given class intervals in the frequency table below.
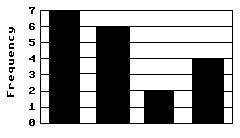
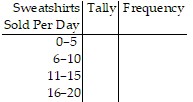
What will be an ideal response?
| 0-5 | 6-10 | 11-15 | 16-20 |
Mathematics
You might also like to view...
Solve the problem. Round rates to the nearest tenth of a percent and dollar amounts to the nearest cent.A local dealer sells baseballs for $25 each. If $7.89 is the markup, what is the cost and the markup on cost?
A. $17.11, 46.1% B. $17.11, 68.4% C. $32.89, 24.0% D. $25.00, 31.6%
Mathematics
Simplify the expression. ?
? 
A. 
B. 
C. 
D. 
Mathematics
For the pair of vectors, find  .
?
.
?
 ?
?
A. ?
B. ?
C. ?
D. 
E. ?
Mathematics
Determine whether the expression is a monomial.9x4y2
A. Yes B. No
Mathematics