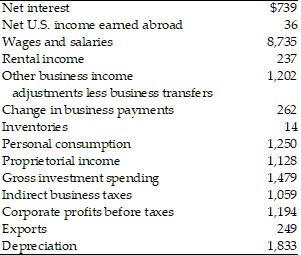
 According to the above table, national income is
A. $10,646 billion.
B. $13,271 billion.
C. $10,770 billion.
D. $11,917 billion.
Answer: B
You might also like to view...
A firm is operating in its range of economies of scale and is on both its LRAC curve and its short-run ATC curve. At that level of output, the slope of its LRAC curve is
A) zero and the slope of its ATC curve is zero. B) zero and the slope of its ATC curve is negative. C) negative and the slope of its ATC curve is zero. D) negative and the slope of its ATC curve is negative.
What types of things are sold in input or factor markets? Who are the buyers and sellers in these markets?
What will be an ideal response?
The expenditure approach to measuring U.S. GDP equals _________
A. the sum of U.S. consumption expenditure and U.S. investment B. U.S. government expenditure minus taxes paid by Americans C. all expenditure on final goods and services produced in the United States in a given time period D. all expenditure by Americans on goods and services produced in the United States in a given time period
An inferior good is
A. generally of low quality. B. purchased in the underground economy. C. is damaged or referred to as a "second". D. purchased in declining quantities as income rises.