Figure 2-10
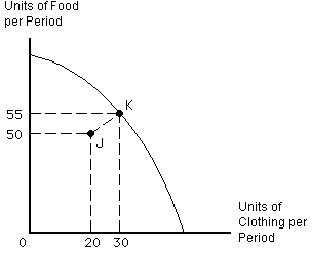
Movement from point K on the production possibilities curve for food and clothing in , to point J inside the curve could be the result of
a.
an increase in opportunity costs
b.
supply and demand
c.
greater efficiency
d.
a decrease in the population
e.
an increase in unemployment
e
You might also like to view...
Using the above figure, CBL is the cost of breaking the law. What is the equilibrium price and quantity if beer is legal?
A) $5 per quart and 300 quarts of beer B) $3 per quart and 500 quarts of beer C) $3 per quart and 100 quarts of beer D) $1 per quart and 300 quarts of beer
The equilibrium real interest rate is the rate ________
A) at which the output gap is zero B) at which the inflation rate is low C) controlled by the central bank D) all of the above E) none of the above
Approximately how many U.S. workers received Trade Adjustment Assistance from 1994 to 2002 as a result of job losses due to NAFTA?
a. 525 million b. 52.5 million c. 5.25 million d. 0.525 million
Which of the following correctly identifies a limitation of logarithmic transformation of variables?
A. Taking log of variables make OLS estimates more sensitive to extreme values in comparison to variables taken in level. B. Logarithmic transformations cannot be used if a variable takes on zero or negative values. C. Logarithmic transformations of variables are likely to lead to heteroskedasticity. D. Taking log of a variable often expands its range which can cause inefficient estimates.