Which of these statistics best describes the relationship in this scatterplot?
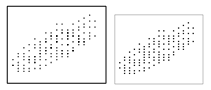
a. r = 1.00
b. r = .65
c. r = –.40
d. r = .00
b. r = .65
Education
You might also like to view...
Creating opportunities for decision making is an important element in the school-to-adult life transition of students with
disabilities. Indicate whether the statement is true or false.
Education
Culturally responsive teaching is solely for ethnic or linguistic minority students and does not benefit those from the majority culture
Indicate whether the statement is true or false.
Education
Nondirective supervision is
a. seldom used by supervisors. b. readily used by supervisors. c. used to manipulate a group to a predetermined decision. d. all of the above.
Education
If a researcher sets the decision rule p value at .05, what is the probability of making a Type I error?
a. 1% b. 5% c. 10% d. 20%
Education