Refer to Table 1.3 and the bar graph.
A. Write a hypothesis regarding gender and weight.
B. What is the dependent variable? What is the independent variable?
C. Based on the data in the graph above, what is your conclusion?
D. Why is a bar graph a good choice for presentation of these data? Would another type of chart be as
effective?
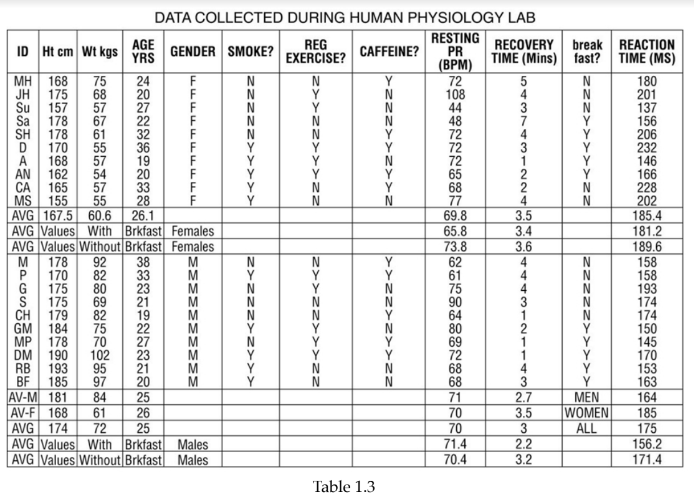
A. Males weigh more than females.
B. Weight depends on gender; thus weight is dependent, gender is independent.
C. Males weigh more than females.
D. Bar graph allows comparison of the average of two groups. No.
You might also like to view...
Which of the following correctly traces blood flow from the renal cortex to the renal vein?
A. Interlobular v. > interlobar v. > segmental v. > renal v. B. Arcuate v. > interlobar v. > segmental v. > renal v. C. Interlobar v. > interlobular v. > arcuate v. > renal v. D. Segmental v. > arcuate v. > interlobar v. > renal v. E. Interlobular v. > arcuate v. > interlobar v. > renal v.
The enzyme ATPase occurs in the globular portion of myosin molecules
Indicate whether the statement is true or false
Functions of the liver include ________.
A. production of many blood proteins B. interconversion of nutrients C. bile production D. detoxification of harmful chemicals E. All of the choices are correct
Classify the shoulder joint
A) uniaxial joint B) nonaxial joint C) biaxial joint D) multiaxial (triaxial) joint