Present data in the form of tables. For the data set shown by the table, a. Create a scatter plot for the data. b. Use the scatter plot to determine whether an exponential function or a logarithmic function is the best choice for modeling the data.Percentage of Population Living in the South Suburbs of a Large City 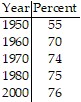

What will be an ideal response?
a.
b. Logarithmic Function
Mathematics
You might also like to view...
Solve.Find the dimensions of a rectangular enclosure with perimeter 54 yd and area 152 yd2.
A. 9 yd by 18 yd B. 8 yd by 18 yd C. 8 yd by 19 yd D. 9 yd by 19 yd
Mathematics
Use a graphing calculator to sketch the graph of the quadratic equation, and then state the domain and range.y = -2x2 + 6x - 5
A. D: (x ? 1.5), R: (y ? -5) B. D: (x ? 1.5), R: all real numbers C. D: all real numbers; R: (y ? -0.5) D. D: all real numbers; R: (y ? -0.5)
Mathematics
For the given functions f and g, find the requested composite function.f(x) =  , g(x) =
  ;
; Find (f ? g)(x).
A. 
B. 
C. 
D. 
Mathematics
Solve the equation algebraically.x(2x + 14) = -24
A. -7, 24 B. -4; -3 C. 0; -7 D. 4; 4
Mathematics