Use the data in the table to construct a bar graph.The following table shows the number of female infants born at Hospital X on New Year's Day (Jan. 1).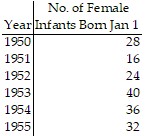
What will be an ideal response?
Answers may vary. One possible answer: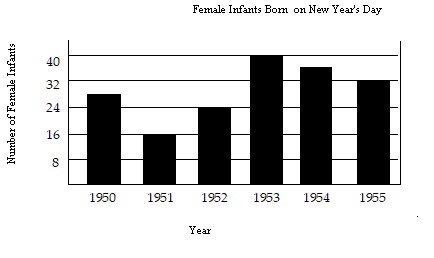
Mathematics
You might also like to view...
Solve the problem.The frequency distribution indicates the test averages of a group of 336 students. Construct a histogram for this data.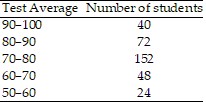
A. 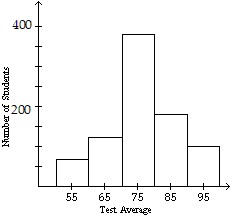
B. 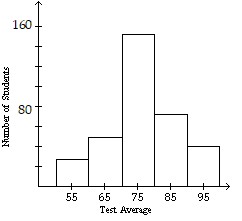
C. 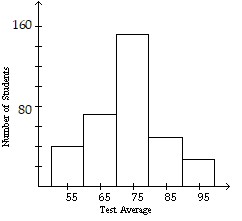
D. 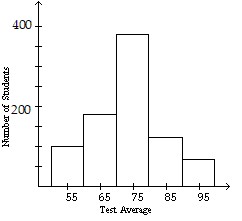
Mathematics
Write out the sum.
A.  +
+  +
+  + ... +
B. 0 +  +
+  + ... +
C.  +
+  +
+  + ... +
D. 1 +  +
+  + ... +
Mathematics
Use the given vectors to find the indicated expression.v = -3i + 2j + k, w = -4i + 3j - kFind (-3v) × w.
A. 15i + 21j + 3k B. -15i + 27j - 3k C. 7i + 9j - 33k D. 3i + 5j + 35k
Mathematics
Perform the indicated operation.(6q2 - 3q - q3 + 2) - (3q2 - 3q - q3 + 4)
A. 2q2 - 6 B. 3q2 - 6q - 6 C. 3q2 - 2 D. 2q2 - 2q3 + 2
Mathematics