Use a graphing calculator to plot the data and find the quadratic function of best fit.The number of housing starts in one beachside community remained fairly level until 1992 and then began to increase. The following data shows the number of housing starts since 1992 (x = 1). Use a graphing calculator to plot a scatter diagram. What is the quadratic function of best fit?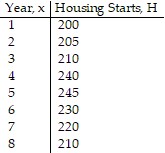
A. H(x) = -2.679x2 + 26.607x + 168.571
B. H(x) = -2.679x2 + 26.607x - 168.571
C. H(x) = -2.679x2 - 26.607x + 168.571
D. H(x) = 2.679x2 + 26.607x + 168.571
Answer: A
Mathematics
You might also like to view...
Complete the magic (addition) square.Use each number 15, 16, 17, 18, 19, 20, 21, 22, and 23 once.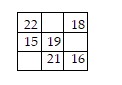
A. 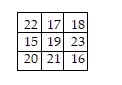
B. 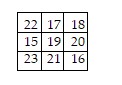
C. 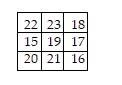
D. 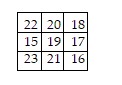
Mathematics
Provide an appropriate response. A measurement is 12.3 sec. Find the greatest possible error of this measurement:
A. 1 sec B. .05 sec C. 0.005 sec D. 0.5 sec
Mathematics
Combine like terms.12 - 10.9x - 12.6x + 11.1
A. -23.5x + 0.9 B. -0.4x C. -23.5x + 23.1 D. -24.5x + 23.1
Mathematics
Use a graphing utility to find the sum of the geometric sequence. Round answer to two decimal places, if necessary.
A. -63 B. -1845 C. -549 D. 72
Mathematics