Provide an appropriate response.Find the perimeter of the given figure.
A. 95 ft
B. 59 ft
C. 225 ft 4 in.
D. 93 ft 8 in.
Answer: A
You might also like to view...
Write as a common fraction.0.8
A. 
B. 
C. 
D. 
The stack plot below shows the value of each of Danny's investments. The stack plot contains three regions. The uppermost unshaded region represents the value of Danny's investment in individual stocks. The center shaded region represents the value of Danny's investment in mutual funds and the bottom region in black represents the value of Danny's investment in a CD. The thickness of a region at a particular time tells you its value at that time.  Use the graph to answer the question.In year 8, approximately what percentage of Danny's total investment was in mutual funds?
A. 50% B. 70% C. 80% D. 60%
Graph the function.y = 0.8 cos x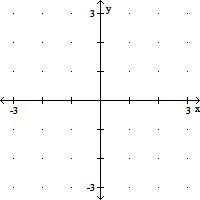
A. 
B. 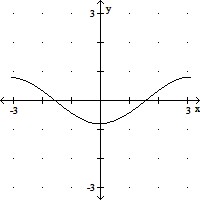
C. 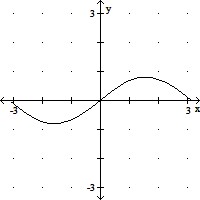
D. 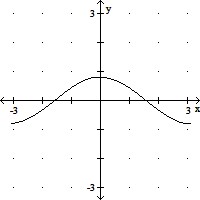
Provide an appropriate response.Loans with a specific number of payments made on a regular basis are called installment loans.
A. True B. False