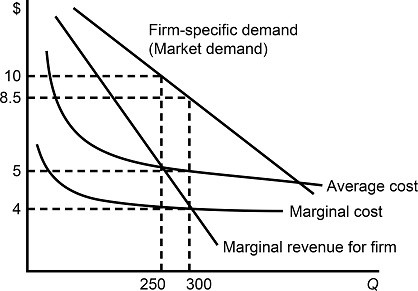
 Figure 8.2 shows demand and costs for a monopolistically competitive firm. At the profit-maximizing output level, the firm's profit is:
A. $1,200.
B. $1,050.
C. $750.
D. $375.
Answer: B
You might also like to view...
Use the information in the table below.Total salesIndustry 1Firm 1$5.3mFirm 2$199,000Firm 3$2.6mFirm 4$850,000What percent of total sales does Firm 4 make up in Industry 1?
A. 8.5% B. 59% C. 29% D. 9%
A normal good is defined as a good
A) for which demand increases when income increases. B) with a downward sloping demand curve. C) for which demand increases when the number of demanders increases. D) for which demand increases when the price of a substitute rises. E) for which demand increases when the price of a complement falls.
The demand schedule for a good shows:
a. the specific quantity of the good that people are willing and able to sell at different prices. b. the positive relationship between the price and the quantity of the good. c. no relationship between the price and the quantity of the good. d. the specific quantity of the good that people are willing and able to buy at different prices. e. the quantity of the good that is sold in the market.
The less time that elapses, the
A. greater the income elasticity of demand for a product. B. less price elastic is the demand for the product. C. smaller the income elasticity of demand for the product. D. more price elastic is the demand for the product.