Exhibit 14-2 Aggregate supply and demand curves
?
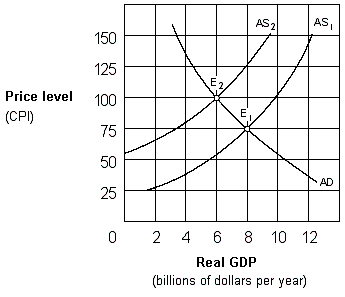
In Exhibit 14-2, the change in equilibrium from E1 to E2 represents:
A. cost-push inflation.
B. demand-pull inflation.
C. price-push inflation.
D. wage-push inflation.
Answer: A
You might also like to view...
U.S. banks have most of their branches in
A) Latin America, the Far East, the Caribbean, and London. B) Latin America, the Middle East, the Caribbean, and London. C) Mexico, the Middle East, the Caribbean, and London. D) South America, the Middle East, the Caribbean, and Canada.
When net capital outflow is negative, it means that on net the value of domestic assets purchased by foreigners exceeds the value of foreign assets purchased by domestic residents
a. True b. False Indicate whether the statement is true or false
Exhibit: Utility) Total utility is maximized at the _______ unit.
a. first b. second c. fourth d. sixth Units 0 1 2 3 4 5 6 7 Total Utility 0 20 35 45 50 50 45 35 Reference: Ref 7-1
Utility refers to how much consumers utilize a product or service.
a. true b. false